Journal of Management Studes at 50: Trends over Time

This was an interesting paper that I contributed a section too. It was a look back, and in a sense, a look forwards at four leading management studies journals, ASQ, JMR, JMS and HRM. My involvement was to look at the changing content of the journals in terms of the frequencies of the words being used. Even just looking at the words we were able to separate papers to their publishing journal, and when displayed as a network of correlations papers tended to cluster into journals. This is interesting as it does indicate that journals do have a house style that people inevitably conform to. The causality of how this happens is not clear, it could either be that journals influence how people write, or that people writing about similar things just tend to use similar words and then publish in a sub-set of journals. Further more we where able to look at the changing word use in a single journal through time. Again we were able to see that papers published in different periods of time tended to be most closely related to each other. The full paper is available online, and there is a poster looking at the data also linked below.

The Language of Management: a longitudinal study of word usage in leading management journals from 1960


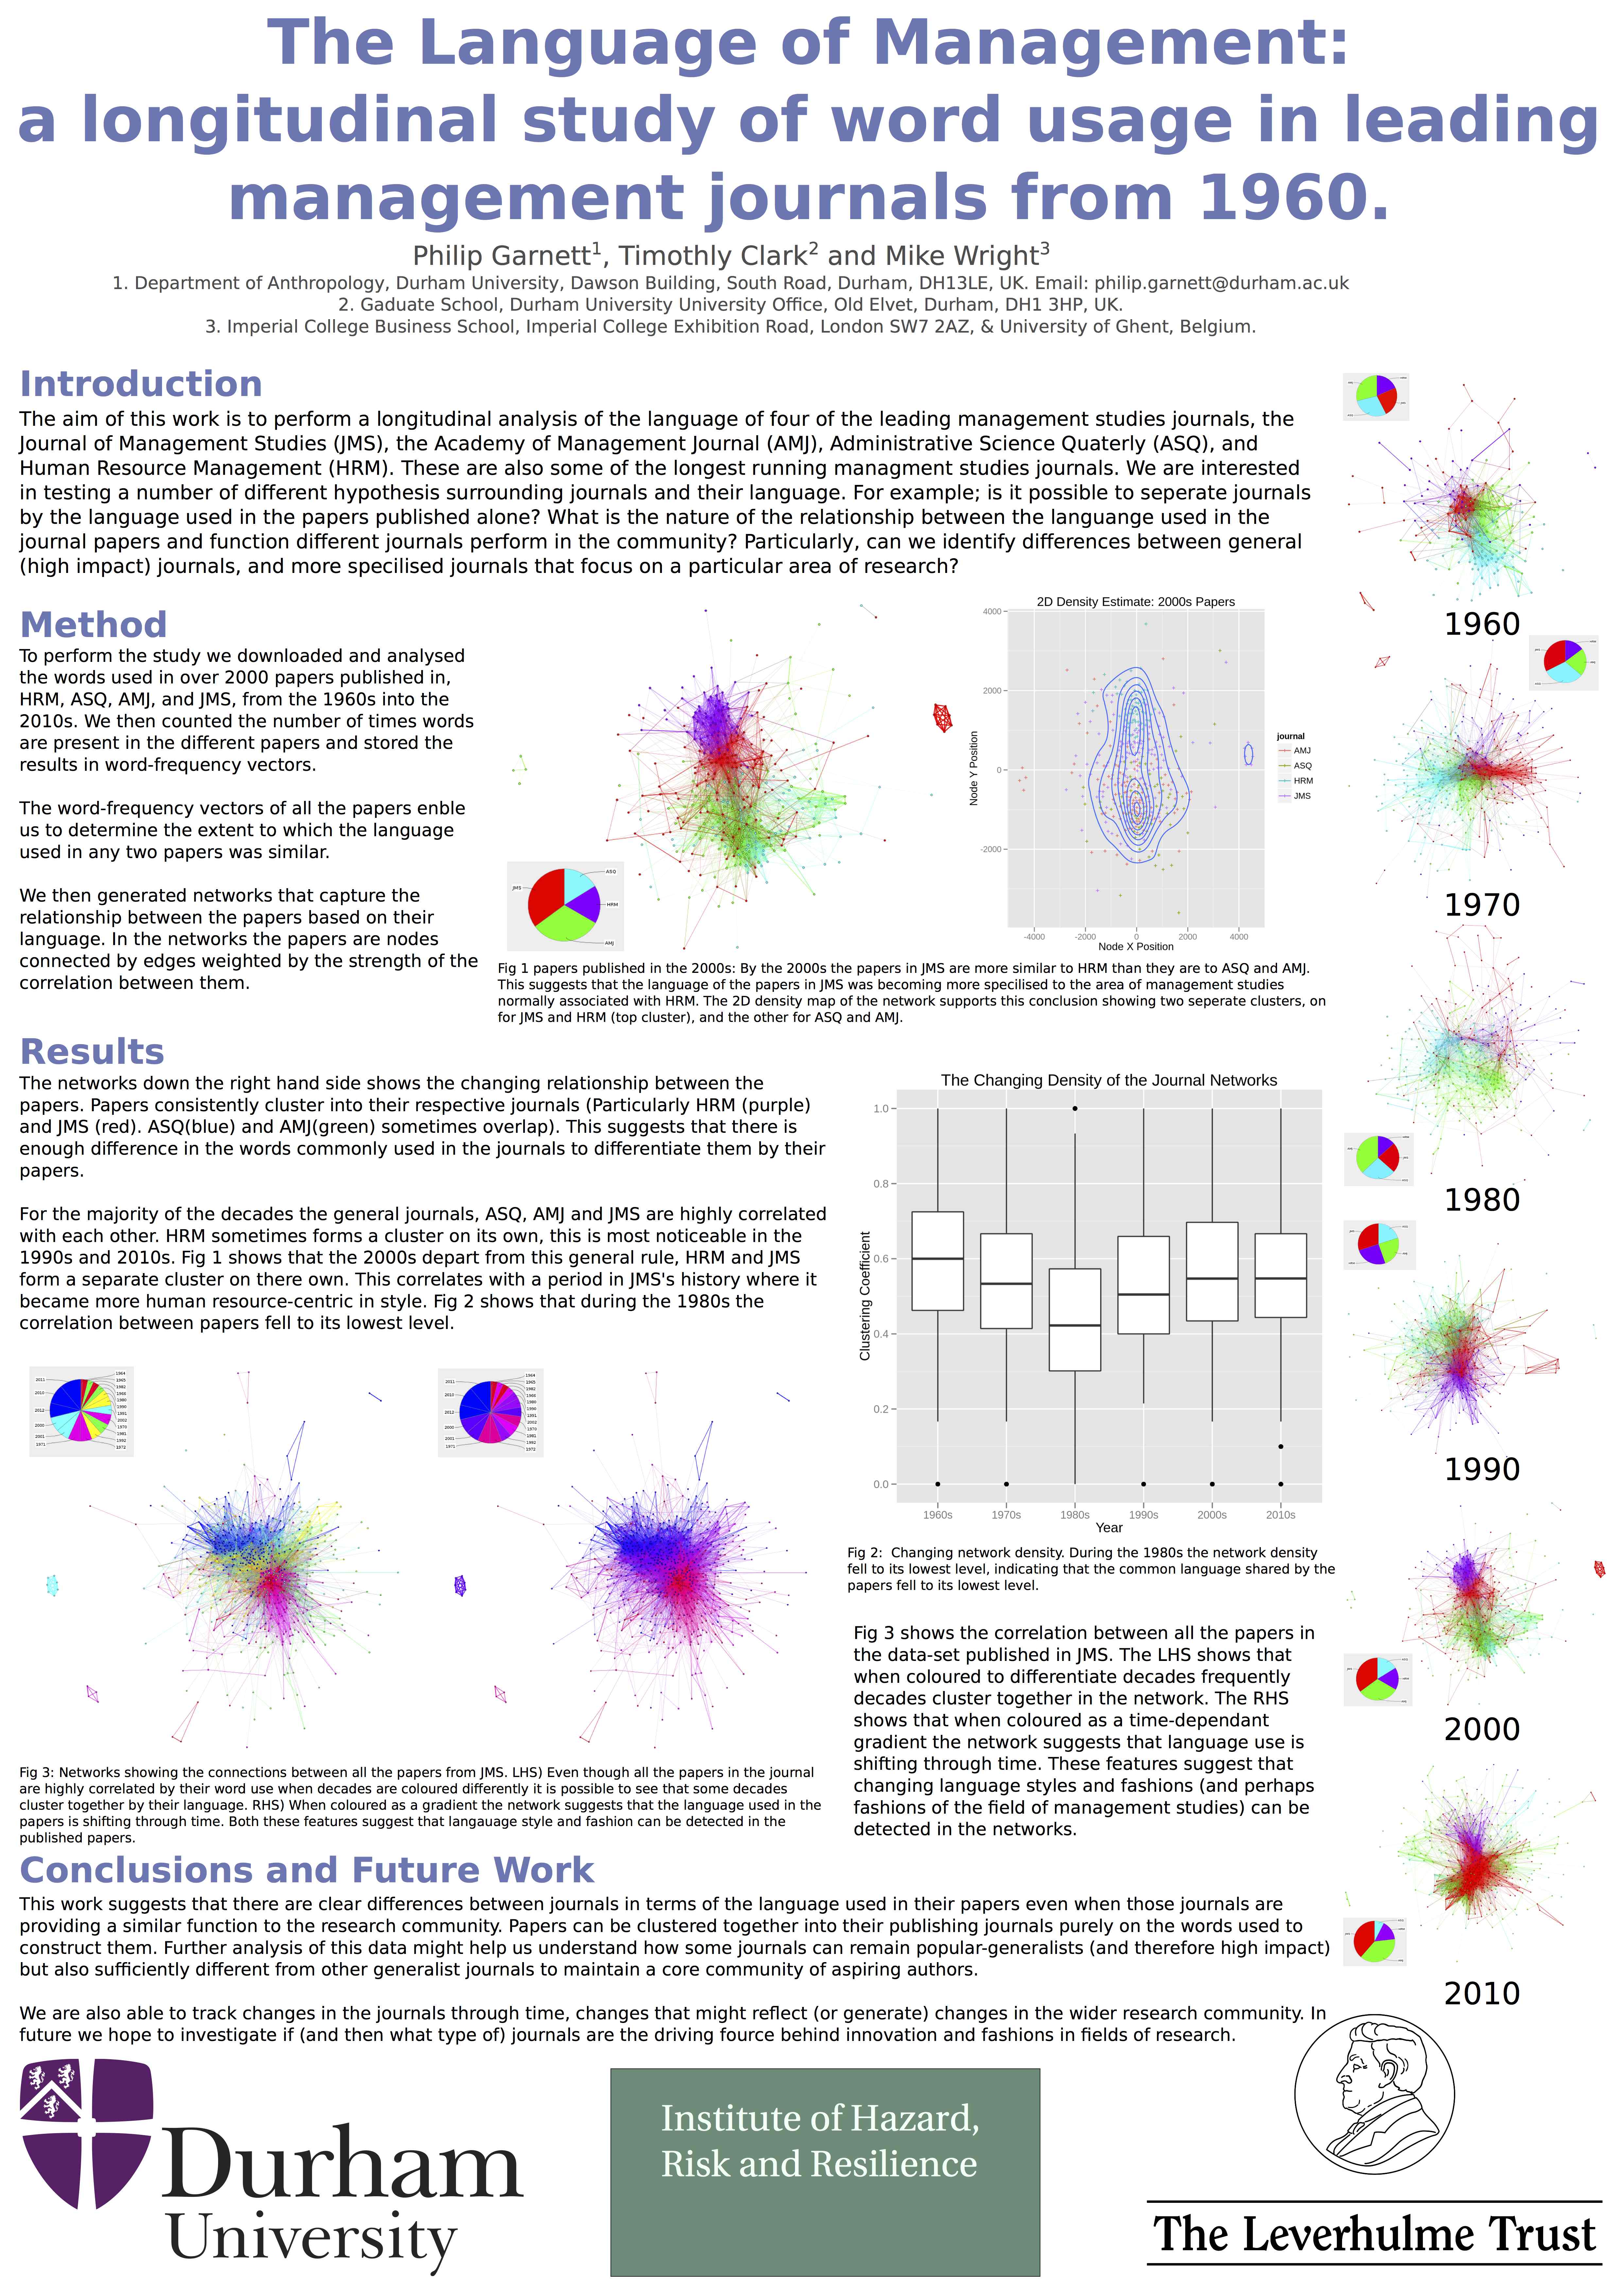
I intend to pick this work up again in the near future.

Bursting a Bubble: Abstract Banking Demographics to Understand Tipping Points?

As part of my work exploring the notion of tipping points I did some work looking at abstract models of populations of Banks. This work actually follows on from earlier work (soon to be published in the Journal of Business History) looking at the development of the British Banking sector. It takes a look, through modelling and simulation, at how the banking sector might have developed had history been different ,while trying to contribute to the debate around what a tipping point is and can it be modelled. Modelling tipping points is difficult because the moment you decide that that is what you are doing, then you have already biased your work. You will inevitably build something that is at least capable of undergoing a tipping point. This paper attempts to explore this problem though the lens of banks. Full text, Bursting a Bubble: Abstract Banking Demographics to Understand Tipping Points?

The Expression of Emotions in 20th Century Books

A new paper is out (PLoS One so free to all), lead by Alberto Acerbi (Bristol Uni), and co-authored by Vasileios Lampos (Sheffield uni), myself (Durham Uni) and R. Alexander Bentley (Bristol Uni). Its a really fun paper looking at the changing pattern in the use of emotion words in the English language during the 20th Century. We make use of Google’s Ngram data. Google scanned approximately 4% of all books and generated a dataset of yearly world frequencies. We mined this dataset to extract the changing frequencies of emotion words throughout the 20th century.

In the data we can see the frequency of words expressing emotions such as anger, fear, joy, sadness, and disgust changing in line with historical events. Large social/cultural events like the World War II, the roaring 20s and the swinging 60s all show up as frequencies changes of words. Interestingly the World War I doesn’t seem to appear in the data, however the Great Depression in the 1930s does. We also expected, due largely to cultural stereo typing, that US books would be more emotional that UK. This is supported by the data, but the split occurs much more recently than we thought it might.  Generally throughout the 20th century the frequency of emotion words has been declining, with one exception, fear. Could that be linked to the climate of fear that has developed during the latter half of the 20th century?

Figure 2. Decrease in the use of emotion-related words through time.
Difference between -scores of the six emotions and of a random sample of stems (see Methods) for years from 1900 to 2000 (raw data and smoothed trend). Red: the trend for Fear (raw data and smoothed trend), the emotion with the highest final value. Blue: the trend for Disgust (raw data and smoothed trend), the emotion with the lowest final value. Values are smoothed using Friedman’s ‘super smoother’ through R function supsmu().

The paper has been really well received in the media, Alberto was interviewed for BBC Radio 4s Material World by Adam Rutherford. Alex and myself were interviewed for NPR.

Articles:

Word Diffusion in Climate Science

Our new data mining and modelling paper is out today, “Word Diffusion in Climate Science“. Investigating the diffusion of climate science words in the Google ngrams dataset. We make observation that there is often a disjoint between the findings of science and the impact it has in the public domain. This existence of a disjoint is particularly significant when it is important the science reaches the public. Our hypothesis is that important keywords used in the climate science discourse follow “boom and bust” fashion cycles in public usage. If these cycles are linked to the science leaving the public eye then perhaps scientist need to think about they can do to ensure important findings reach as many people as possible.

Durham university press release (including a rather-too-big-for-my-liking picture of me).

Lots of work to come…

One year into the Tipping Points project and things are starting to really get going. One paper in submission and another excepted into a conference that will most likely be worked up into a full journal paper. About to submit a conference abstract to the European Conference on Complexity, and the possibility to present some work to the University of Kyoto (fingers crosses!).

We also presenting some work on the developmental ecology of the UK banking section at a workshop in York. This went down so well that we have been invited to a workshop in Liverpool to present things in more detail! All good stuff.