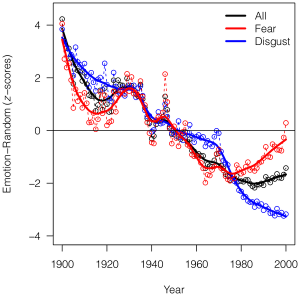
I recently did an invited talk for the student linguistics group at York St John University in York. The paper was broadly on the analysis of Ngrams data and was therefore a something of a summary of about 5 papers that I have been involved with over a number of years. It was nice to do a sort of overview of a fairly long project, and I was able to give the students a sense of how a program of research evolves as you get further into the empirical evidence and have to construct and test theories about what it is that you think is going on.
The work is an analysis of Google Ngrams data, where we attempt to explain the observed changes in word frequencies. Including the links between events and the words that we use in our language. We also investigated the explanatory power of the neutral model, and how well it fits changing patterns of word frequencies. I have linked the slides below so you can see what was presented, and the references are below that show the evolution of the work. I think I will do a podcast of this work in the future as I think its an interesting story.
- Ruck, Damian, R. Alexander Bentley, Alberto Acerbi, Philip Garnett, and Daniel J. Hruschka. 2017. “Role Of Neutral Evolution In Word Turnover During Centuries Of English Word Popularity.” Advances in Complex Systems 20 (06n07). World Scientific Publishing Co.:1750012.
- A Skrebyte, P Garnett, JR Kendal (2016). “Temporal Relationships Between Individualism–Collectivism and the Economy in Soviet Russia A Word Frequency Analysis Using the Google Ngram Corpus.” Journal of Cross-Cultural Psychology, Vol 47, Issue 9.
- Acerbi, A., Lampos, V., Garnett, P., & Bentley, R. A. (2013). “The Expression of Emotions in 20th Century Books.” PLoS ONE, 8(3), e59030. doi:10.1371/journal.pone.0059030.
- Bentley, R. A., Garnett, P., O’Brien, M. J., & Brock, W. A. (2012). “Word Diffusion and Climate Science.” PLoS ONE, 7(11), e47966. doi:10.1371/journal.pone.0047966.
