The released Panama data comes in the form of a Neo4J database, or the files that you can make one with, seems to me a little tricky to do much with. There is no detail beyond attributes of the different entities, so that limits us to looking at the relationships alone and it is hard to judge the significance of the relationships without the context… that said its a fun data set to play with.
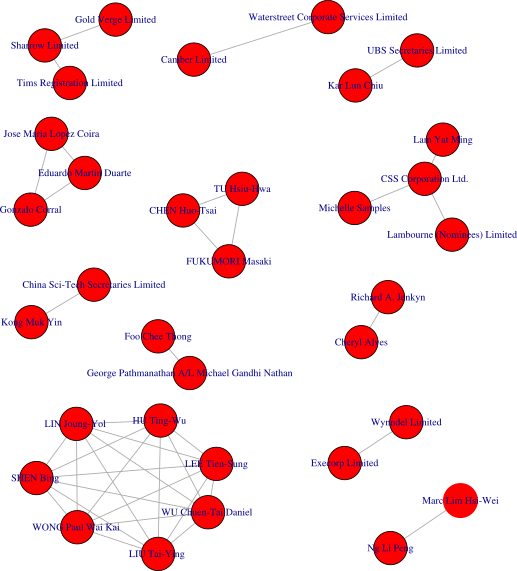
I decided to draw out some graphs of how things are connected via other things. Below is one from Officers connected to other Officers via *something* else, generated via R using iGraph from the Neo4J data set. This produces a few clusters containing a relatively small number of nodes connected to others. The query that produces the graph is, “MATCH (n:Officers)-[:`officer of`]->(o)<-[:`officer of`]-(m:Officers) WHERE NOT id(n)=id(m) AND id(n)<id(m) RETURN n.name AS Officer1, m.name AS Officer2, count(o) AS Weight”